If you're experiencing problems with the web application and none of the troubleshooting steps helped, we'll need to look into your browser console.
The browser console provides information on webpage errors that may not have been seen directly on the TimeCamp end. It can be handy if we cannot reproduce the problem you're experiencing.
Please follow these steps and send us screenshots of your console or record a video so we can analyze logs on each step.
1. Open the console
To open the browser console on most browsers, you can use one of these options:
- Right-click your mouse and choose “Inspect” from the menu;
- Use the keyboard shortcuts
Chrome: Ctrl+Shift+J on Windows/Linux or Cmd+Option+J on macOS
Edge: hit F12
Firefox: Ctrl+Shift+K on Windows/Linux or Cmd+Option+K on macOS
Safari: Cmd + Option + C

2. Console tab
Make sure to open the Console tab on the menu.

3. Recreate the problem
When the Console tab is opened, refresh the browser and then repeat the steps to recreate the problem you're experiencing with TimeCamp.
After recreating the problem please take a screenshot of what appears in the Console view or record the entire process.

If there are page errors, usually they’ll appear in red.
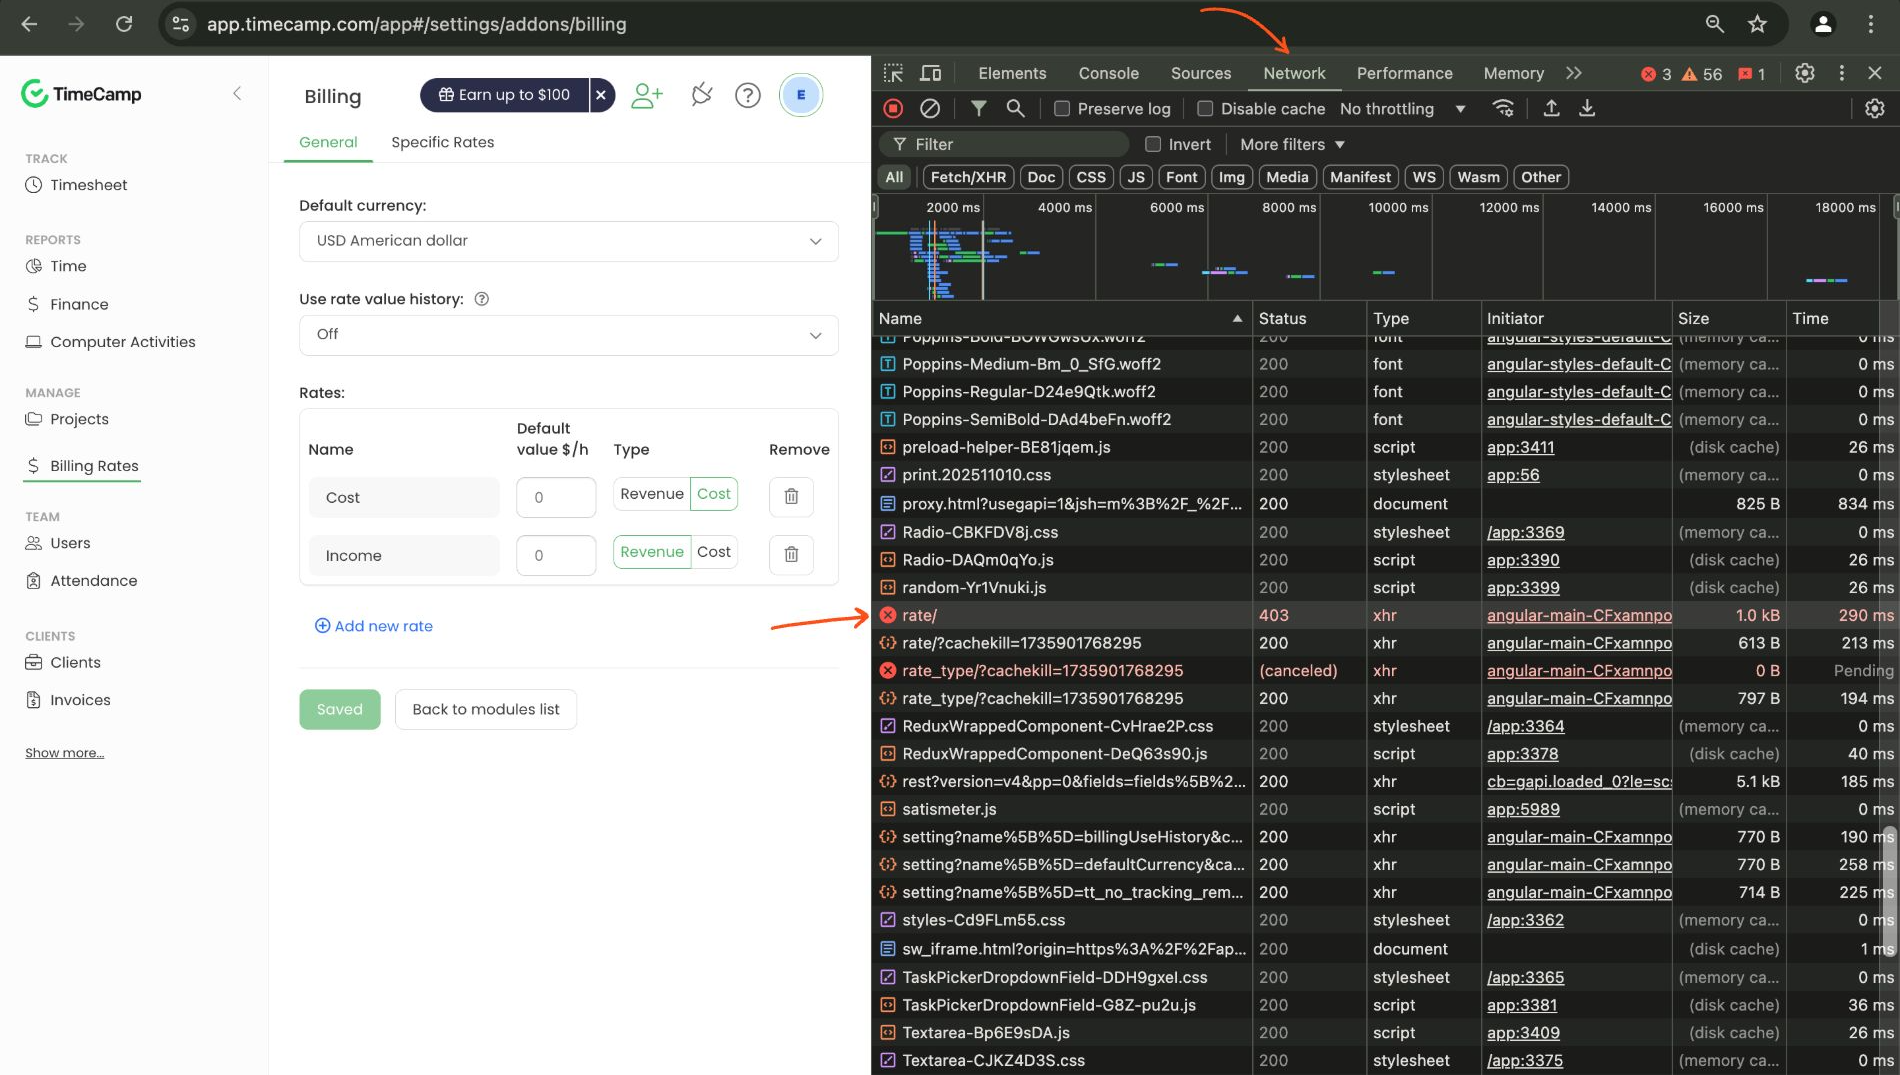
4. Network tab
Browser network information highlights any internet connection issues causing errors.
Open the Network tab on the menu.

Tick the checkbox next to the Preserve log option.

After recreating the problem please take a screenshot of what appears in the Network view or record the entire process.

Please capture any errors, and click on them to check the Headers, Preview, and Response tabs. Sometimes they contain an error code that can be identified on our end.
If there are page errors, usually they’ll appear in red.
5. Send us screenshots or a video
Please send us all the screenshots you've taken or a video record you've made, including the browser version in your message.
Example: